How to profile C# 9.0 Source Generators
C# 9.0 source generators are progressing a lot lately, with the addition of generated symbols IDE navigation, as well as the stabilization of the generation APIs.
As generators are run a part of the compiler’s pipeline, when creating small generators, or processing small inputs, performance profiling can be done quite easily, and even easier using Chris Sienkiewicz’s kittitas tool, which packages the generation driver inside a single, easy to use tool.
Yet, when the build is more complex, or the solution takes an important environmental set of parameters (such as Directory.Build.props), some in-place debugging may be required.
Read on to find out how to do this.
In-Place Profiling of Source Generators using Visual Studio
While debugging the Uno source generators’ migration to C# 9.0, I found out that the generation was taking quite a while, particularly at the last stage of the many-projects solution that builds Uno itself.
As the generators are part of the build pipeline, one way to profile the generators is to actually profile the invocation of csc.exe itself. Note that you can debug your generators using the Debugger.Launch() technique (Nick has a great blog entry about this).
To profile your generators, first you’ll need to :
- Install the Visual Studio Project System Tools. Those tools enable the generation of msbuild binlog files from within Visual Studio. Binlogs are even created for design time builds, a nice touch.
- Install the amazing MSBuild Binary and Structured Log Viewer, an amazing tool by Kirill Osenkov. You may need to open it once for the
.binlogextension to be registered.
Then, you’ll need to do the following:
- In the Tools menu, Options, go to Project and Solutions, Build and Run, then select Diagnostics in the MSBuild project build log verbosity options.
- Go to the View, Other Windows, Build Logging menu to open the Build Logging tool window
- In that Build Logging window, click on the Play icon to start the logging
- Build your project which uses the source generators
- Once built, in the Build Logging window, select the line that contains your project’s build results, and right click Open Logs External.
- In the top left text box, type
csc.exe, you’ll find the actual command line visual studio used to build the code from your project, including the generators’ execution. - In tree view on the left, click on the line
Property CommandLineArguments = ... - On the right, the full line is selected and right click to Copy Value
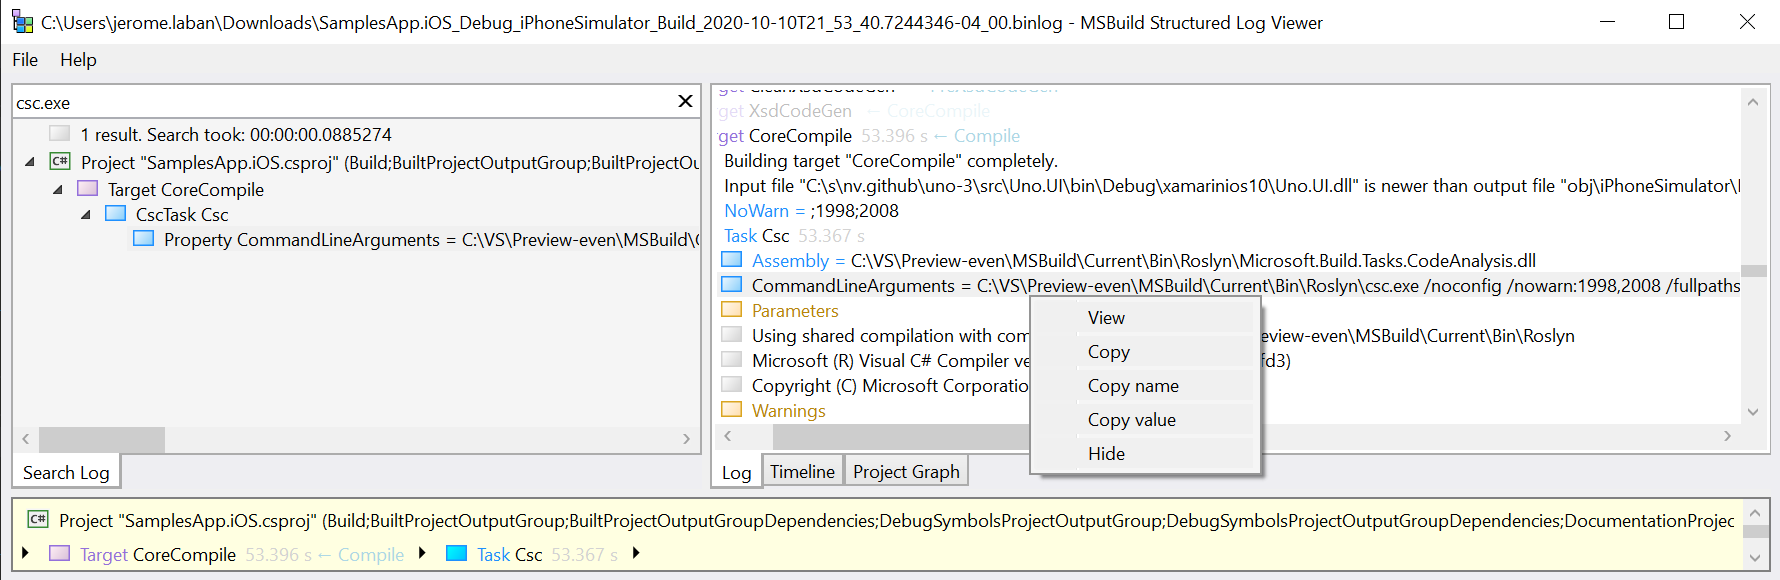
- Paste the content in your favorite text editor
Now, let’s configure your generators project to be profiled:
- Set your generators project as startup in the solution explorer
- Open the generators project properties, and the Debug tab
- Take the path to your csc.exe in the file created above, and set it to the Executable
- Set the Working directory to the folder containing the project that was previously built
- Save the file created with the compiler options, while removing the path to csc.exe, leaving only the command line parameters. This file can be anywhere, let’s say
C:\Temp\myresponsefile.rsp - In the Application arguments, set the following:
@C:\Temp\myresponsefile.rspThis will instruct the compiler to take its command line parameters from the response file we created.
- Go to the Debug, Performance Profiler menu, select CPU Usage
- Click Start
And voila!
It’s not the simplest of steps, but it works pretty nicely.
Note that the response file is not strictly necessary, but if your project has lots of files (which is the case for the Uno.UI solution), the Application arguments field is characters limited and may not work properly.
In closing
In the context of debugging Uno’s generators, here’s what came out:
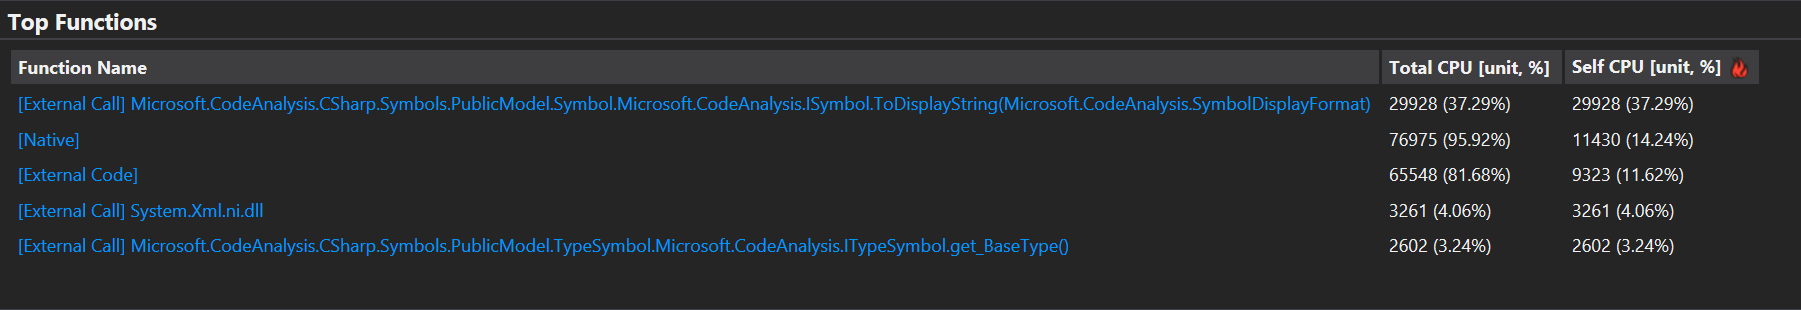
Indicating that the generators are spending a lot of time generating the names of ISymbol instances.
Looks like we’re going to have a good time improving the performance of Uno’s source generators!
Until next time, happy generation!